Click to Enlarge
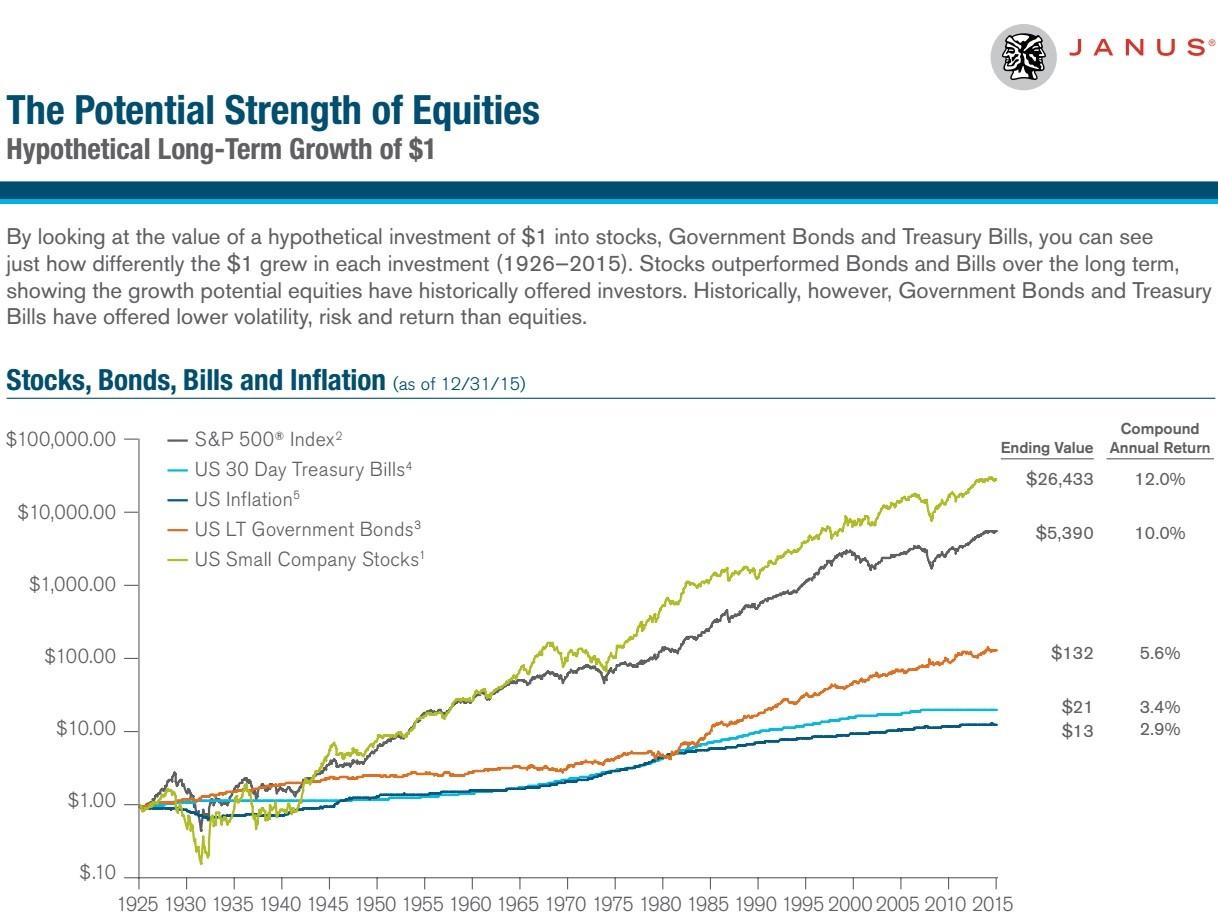
Growth of $1 Investment: 1926-2015
| Index |
Compounded Return |
| US Small Company Stocks |
12.0% |
| S&P 500 Index |
10.0% |
| US LT Government Bonds |
5.6% |
| US 30 Day Treasury Bills |
3.4% |
| US Inflation |
2.9% |
U.S. treasury securities are direct debt obligations issued by the U.S. Government. With government bonds, the investor is a creditor of the government. Treasury Bills and U.S. Government Bonds are guaranteed by the full faith and credit of the U.S. Government, are generally considered to be free of credit risk and typically carry lower yields than other securities. Bonds in a portfolio are typically intended to provide income and/or diversification. In general, the bond market is volatile.
Bond prices rise when interest rates fall and vice versa. This effect is usually pronounced for longer-term securities. Any fixed income security sold or redeemed prior to maturity may be subject to a substantial gain or loss.
Stocks represent ownership interest in a company. Stock investments have the potential to deliver high returns. However, with that potential, there are also some risks. The value of equity securities fluctuates in response to the issuer, political, market and economic developments. In the short term, equity prices can fluctuate dramatically in response to these developments which can also affect a single issuer, issuers within an industry, economic sector, geographic region or the market
as a whole. Their performance has historically been more volatile than other asset classes.
Past performance is no guarantee of future results.
1Small Company Stocks – represented by the Ibbotson® Small Company Stock Index. 2Large Company Stocks – represented by the Standard & Poor’s 90 Index from 1926 through February 1957 and the S&P 500® thereafter, which is an unmanaged group of securities and considered to be representative of the U.S. stock market in general. 3Government Bonds – represented by 20-year U.S. Government Bond; 4Treasury Bills – represented by 30-day U.S. Treasury Bill (no longer actively traded); 5Inflation – reported by Consumer Price Index as of 12/31/15.
The indices are unmanaged and not available for direct investment, therefore their performance does not reflect the expenses associated with the active management of an actual portfolio.
This is for illustrative purposes only and not indicative of any investment. Data shows hypothetical value of $1 invested at the beginning of 1926 and assumes reinvestment of income and no transaction costs or taxes. The average return represents a compound annual return. The rates of return are hypothetical and do not represent the returns of any particular investment.
Click Here for Your Long Term Care Insurance Quotes


 Business Retirement Plans 2016