
How the S&P 500 Performed During Major Market Crashes – Visual Capitalist – 08/05/20
Click to Enlarge
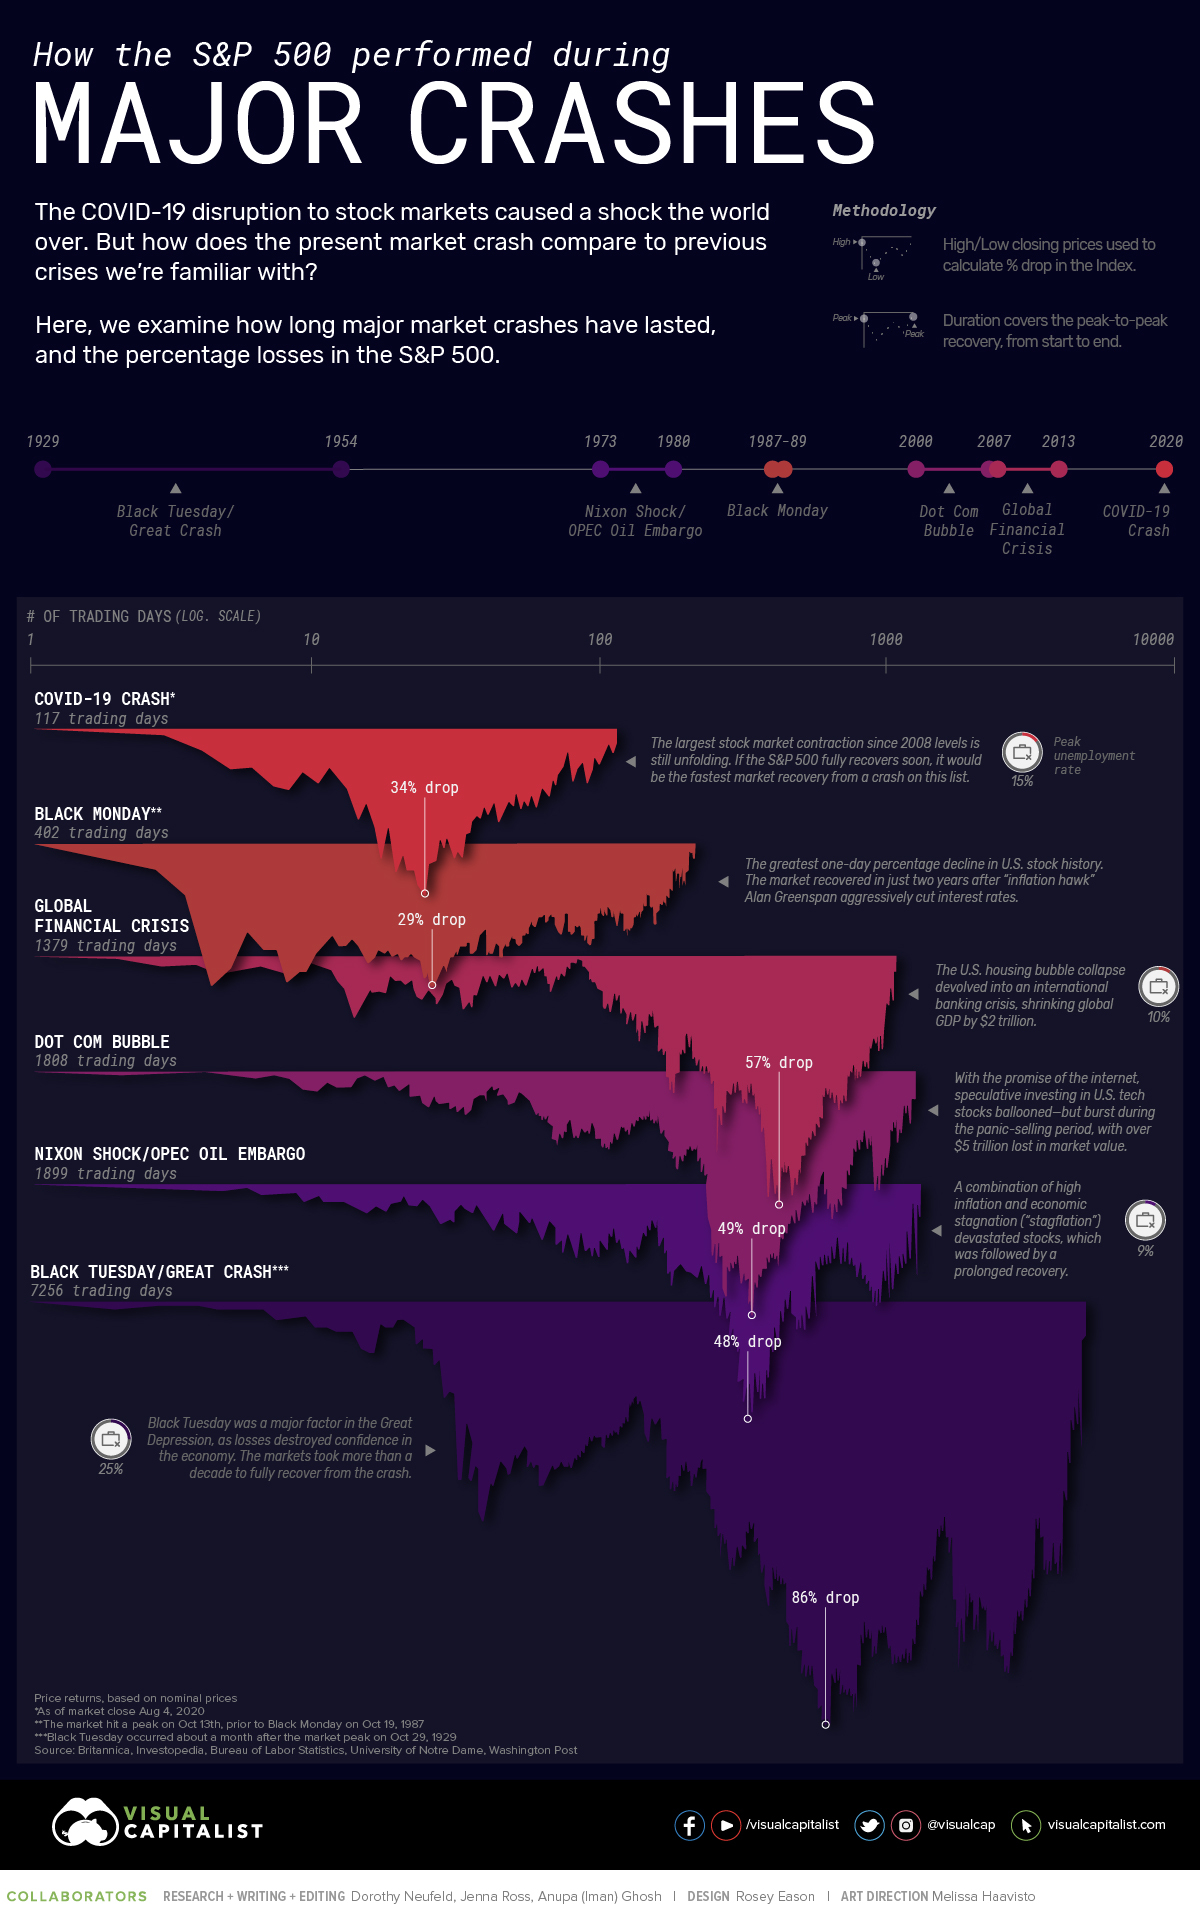
How the S&P 500 Performed During Major Market Crashes
How does the current COVID-19 crash of 2020 stack up against previous market crashes?
| Title | Start — End Date | Duration (Trading Days) | % Drop |
|---|---|---|---|
| Black Tuesday / Great Crash* | Sep 16, 1929 — Sept 22, 1954 | 300 months (7,256 days) | -86% |
| Nixon Shock / OPEC Oil Embargo | Jan 11, 1973 — Jul 17, 1980 | 90 months (1,899 days) | -48% |
| Black Monday** | Oct 13, 1987 — May 15, 1989 | 19 months (402 days) | -29% |
| Dot Com Bubble | Mar 24, 2000 — May 30, 2007 | 86 months (1,808 days) | -49% |
| Global Financial Crisis | Oct 9, 2007 — Mar 28, 2013 | 65 months (1,379 days) | -57% |
| COVID-19 Crash*** | Feb 19, 2020 — Ongoing | 5 months+ (117+ days) | -34% |
Price returns, based on nominal prices
*Black Tuesday occurred about a month after the market peak on Oct 29, 1929
**The market hit a peak on Oct 13th, prior to Black Monday on Oct 19,1987
***As of market close Aug 4, 2020