
Visualizing the Longest Bull Markets of the Modern Era – Visual Capitalist – 06/14/18
Click to Enlarge
Visualizing the Longest Bull Markets of the Modern Era
RANKING THE BULLS
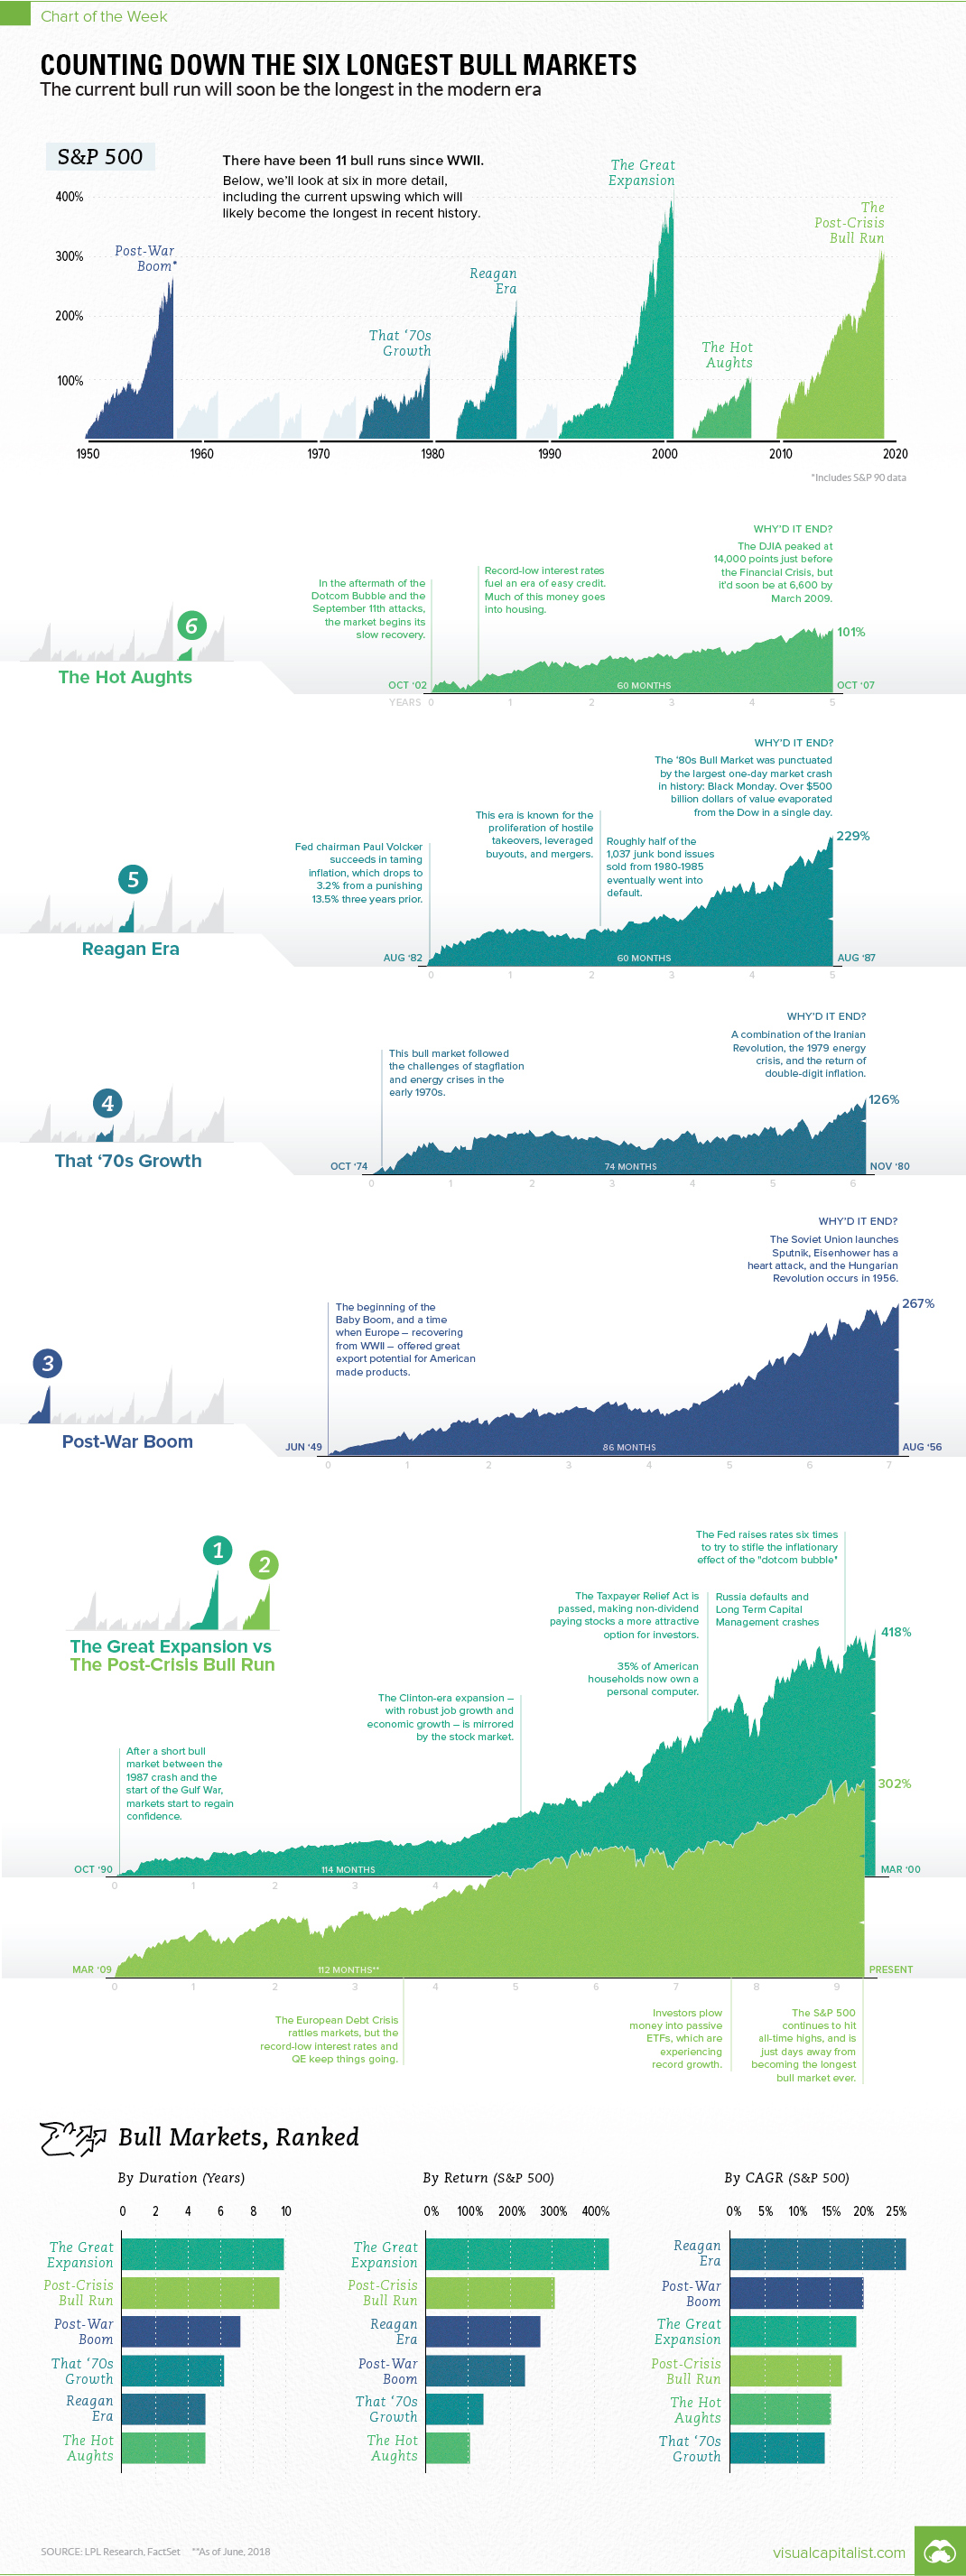
In today’s chart, we show every bull market since WWII, including the top six which are covered in more detail:
| Rank | Bull Market | Dates | Months | S&P 500 Return | Annualized Return |
|---|---|---|---|---|---|
| 1 | Great Expansion | ’90-’00 | 114 | 418% | 19.0% |
| 2 | Post-Crisis Bull Run | ’09-’18* | 112* | 302% | 16.7% |
| 3 | Post-War Boom | ’49-’56 | 86 | 267% | 20.0% |
| 4 | That ’70s Growth | ’74-’80 | 74 | 126% | 14.1% |
| 5 | Reagan Era | ’82-’87 | 60 | 229% | 26.7% |
| 6 | The Hot Aughts | ’02-’07 | 60 | 101% | 15.0% |
*Still in progress.
The current run, which will soon become the longest, didn’t have the same level of intensity as other high-ranking bull markets. Critics would say that it was artificially propped up by ultra-low rates, QE, and other government actions that will make the market ultimately less robust heading forward.
Regardless, the current run ranks in fourth place among the markets above in terms of annualized return.
Click Here for Your Long Term Care Insurance Quotes