Click to Enlarge

Past performance is no guarantee of future results. Investing involves risk, including the possible loss of principal and fluctuation of value. Equity and fixed income securities are subject to various risks including, but not limited to, market risk, credit risk and interest rate risk.
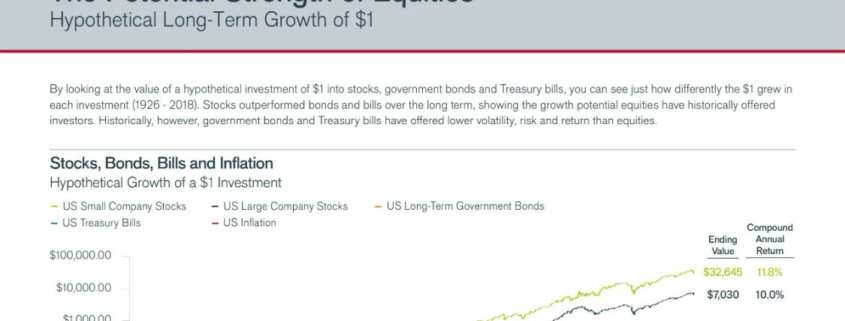
Growth of $1 Investment: 1926-2018
| Index |
Compounded Return |
| US Small Company Stocks |
11.8% |
| US Large Company Stocks |
10.0% |
| US LT Government Bonds |
5.5% |
| US 30 Day Treasury Bills |
3.4% |
| US Inflation |
3.0% |
U.S. Treasury securities are direct debt obligations issued by the U.S. government. With government bonds, the investor is a creditor of the government.
Treasury bills and U.S. Government Bonds are guaranteed by the full faith and credit of the U.S. Government, are generally considered to be free of credit risk and typically carry lower
yields than other securities.
US Small Company Stocks represented by the Ibbotson Small Company Stock Index. US Large Company Stocks represented by the S&P 90 Index from 1926 through February 1957 and the S&P 500® Index thereafter. US Long-Term Government Bonds represented by 20-year U.S. Government Bond.
Treasury Bills represented by 30-day U.S. Treasury Bill (no longer actively traded). Inflation represented by Consumer Price Index.
Index performance does not reflect the expenses of managing a portfolio as an index is unmanaged and not available for direct investment.
The example provided is hypothetical and used for illustration purposes only. It does not represent the returns of any particular investment.
Click Here for Your Long Term Care Insurance Quotes


