
Growth of $100 by Asset Class: 1970-2023
Click to Enlarge
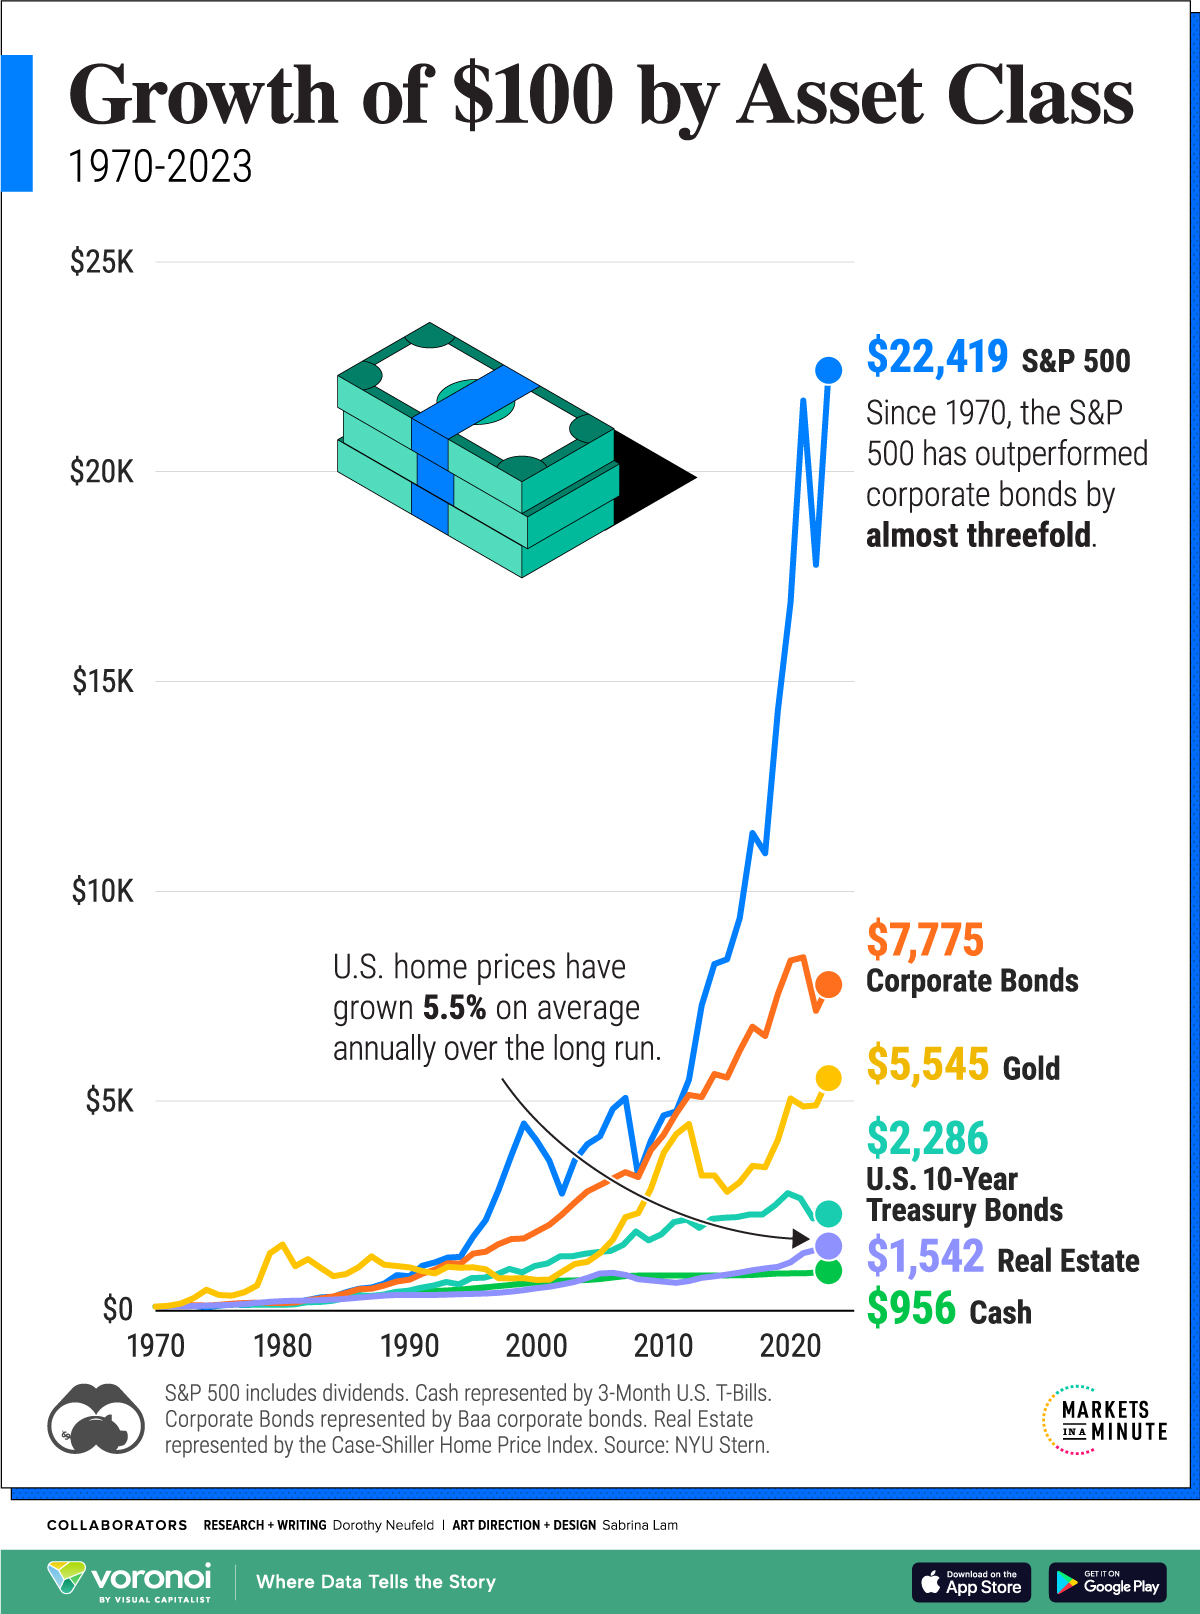
Past performance is no guarantee of future results. Hypothetical value of $100 invested at the beginning of 1970. Assumes reinvestment of income and no transaction costs or taxes. This is for illustrative purposes only and not indicative of any investment. An investment cannot be made directly in an index.
Investing involves risk, including the possible loss of principal and fluctuation of value. Equity and fixed income securities are subject to various risks including, but not limited to, market risk, credit risk and interest rate risk.
Comparing Asset Class Returns
Below, we show the returns of a $100 investment across major asset classes—from U.S. stocks to gold—between 1970 and 2023:
| Year | S&P 500 | Corporate Bonds |
Gold | U.S. 10-Year Treasury Bonds |
Real Estate | Cash |
|---|---|---|---|---|---|---|
| 1970 | $100 | $100 | $100 | $100 | $100 | $100 |
| 1980 | $226 | $181 | $1,578 | $141 | $229 | $192 |
| 1990 | $823 | $741 | $1,033 | $477 | $374 | $431 |
| 2000 | $4,060 | $1,886 | $734 | $1,067 | $536 | $682 |
| 2010 | $4,656 | $4,191 | $3,760 | $1,821 | $693 | $840 |
| 2020 | $16,890 | $8,349 | $5,059 | $2,802 | $1,155 | $891 |
| 2023 | $22,419 | $7,775 | $5,545 | $2,286 | $1,542 | $956 |
Numbers have been rounded. S&P 500 includes dividends. Cash represented by 3-Month U.S. T-Bills. Corporate Bonds represented by Baa corporate bonds. Real Estate represented by the Case-Shiller Home Price Index.
Index performance does not reflect the expenses of managing a portfolio as an index is unmanaged and not available for direct investment.
The example provided is hypothetical and used for illustration purposes only. It does not represent the returns of any particular investment.